Debug Performance Issues using Fusion Reactor
Learn how to setup Fusion Reactor tool for WaveMaker Application Performance Monitoring.
WaveMaker platform generates Spring and Hibernate code for the application backend and it is very easy to debug the performance related issues with third party Application Performance Monitoring (APM) tools like App Dynamics and Fusion Reactor.
In this document, learn how to configure Fusion Reactor to monitor app performance and get the level of depth and insights to instantly identify issues. For more information about this tool, see this doc.
To try the sample live demo, see Fusion Reactor Demo.
Prerequisites
Sign-up for a Fusion Reactor account.
Download the required debug libraries, including FusionReactor JAR, and native debug native libraries. For more information, see Fusion Reactor libraries.
Supported Web Server. For more information, see system requirements.
Installation setup in Web Server
The following steps guide you how to install Fusion Reactor in a Tomcat server with a Linux environment. For other server installations, see application server examples.
Tomcat Linux
- Create a folder in your server and place the Fusion Reactor jar and debug libraries.
- Navigate to the following directory in Tomcat
{Apache_Tomcat_Home}/bin/. - Locate the
setenv.shfile. If the file does not exist, create the file. - Open the file with a text editor.
- Locate the FusionReactor Java Agent Jar and the FusionReactor Production Debugger values in the
setenv.shfile as shown in the example below and save the changes.
Example
setenv.sh
#FusionReactor JVM start options. Please do not edit these options.

FR_OPTS="-javaagent:/opt/fusionreactor/instance/tomcat8/fusionreactor.jar=address=8088 -agentpath:/opt/fusionreactor/instance/tomcat8/libfrjvmti_x64.so"
export JAVA_OPTS="$JAVA_OPTS $FR_OPTS"

#End of FusionReactor opts
For more information on installation process, see FusionReactor Installation Guide and for video tutorials, see FusionReactor Video Tutorials.
Accessing FusionReactor
After installing and starting your JEE server, follow the steps below for accessing the tool.
Accessing Fusion Reactor's Internal Web Server
- You can call FusionReactor directly from a web browser with a URL.
Example URL: http://127.0.0.1:8088/fusionreactor/
You must use the correct IP address and port for the FusionReactor instance.
http://<your server IP>:<port configured in the setenv.sh file during installation>/fusionreactor/
- The port will be configured in
setenv.shfile and address on which FusionReactor listens are configurable. - After installing and starting your JEE server, enter your license key and activate it.
External Web Server
You can access FusionReactor from your external web server with a URL like this http://demo.fusion-reactor.com/fusionreactor.jsp/findex.htm
Note that we have used an extension .jsp in this case so that the external web server maps to the monitored application engine. The request is passed to FusionReactor which runs inside the application engine. Access to FusionReactor from the external web server can be configured to on or off.
Debug or Monitor Performance Issues using Fusion Reactor
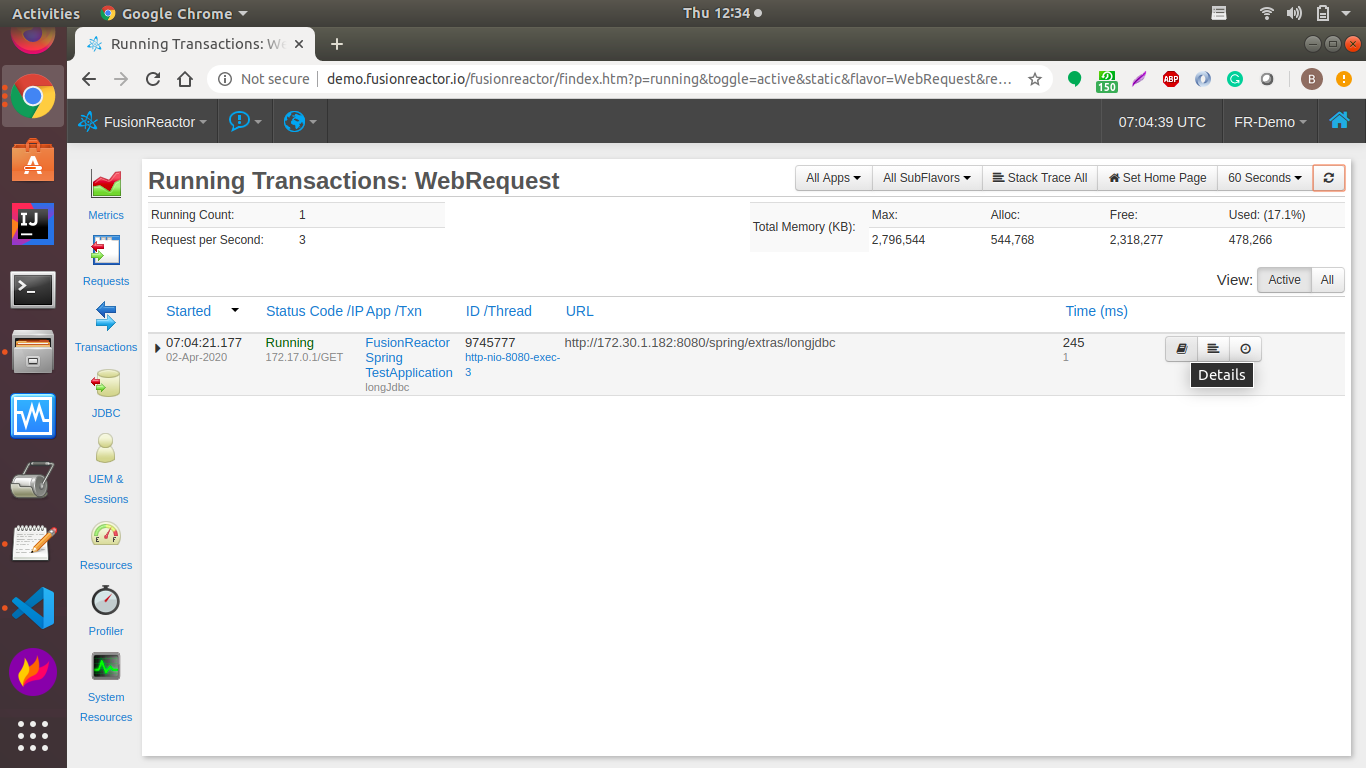
After configuring fusion reactor in web server, access your WaveMaker application and load the Webpage where you observe slowness or slow network calls in browser network tab.
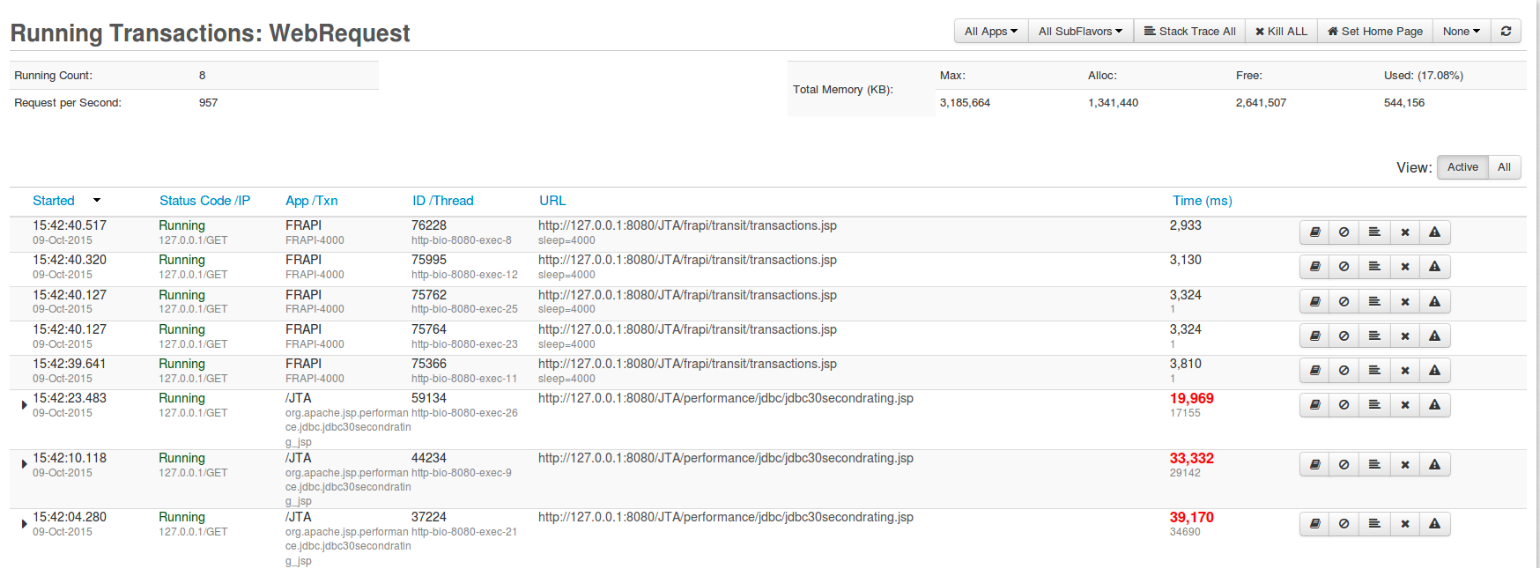
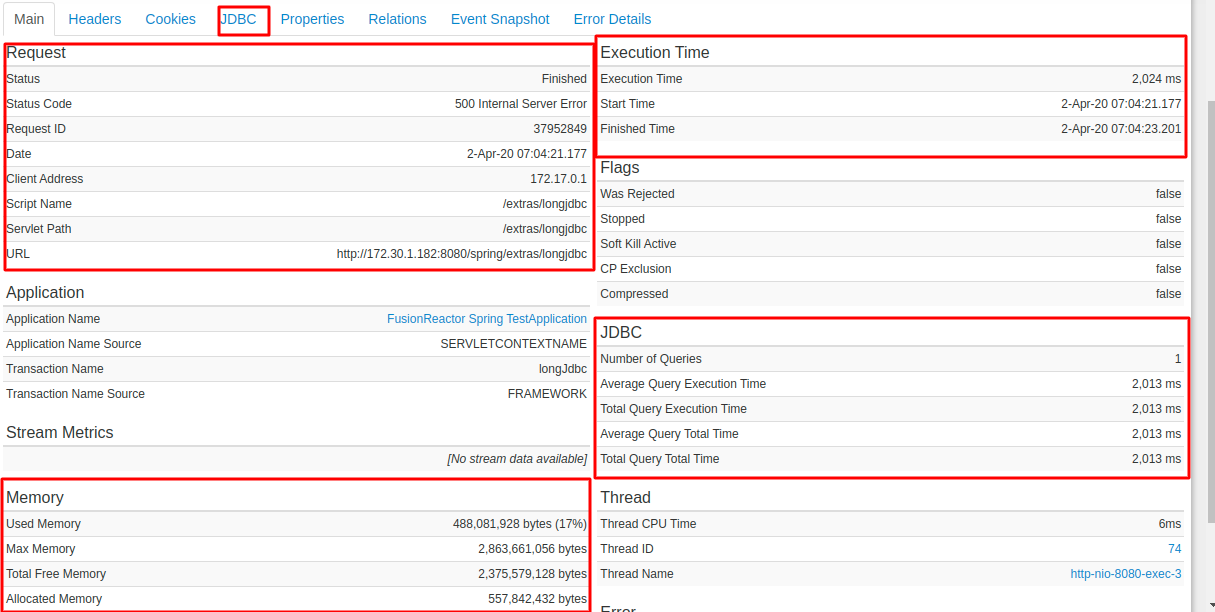
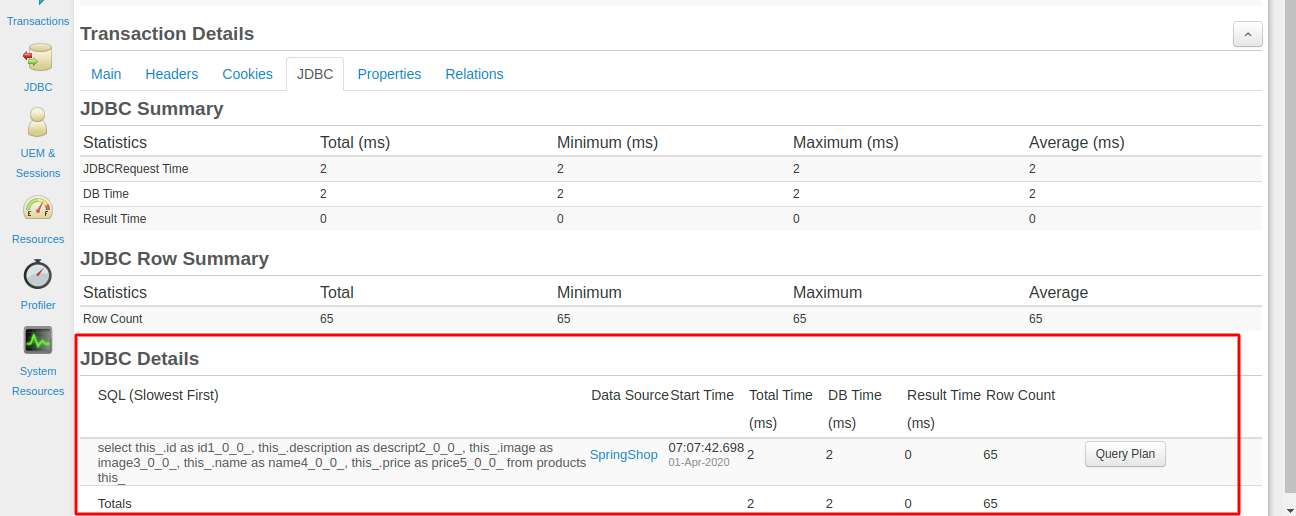
You can view details of the running transaction request with data related to JDBC Query analysis and Profiler for method execution times and more sections, which help you identify the root cause of the slowness.
Metrics Section
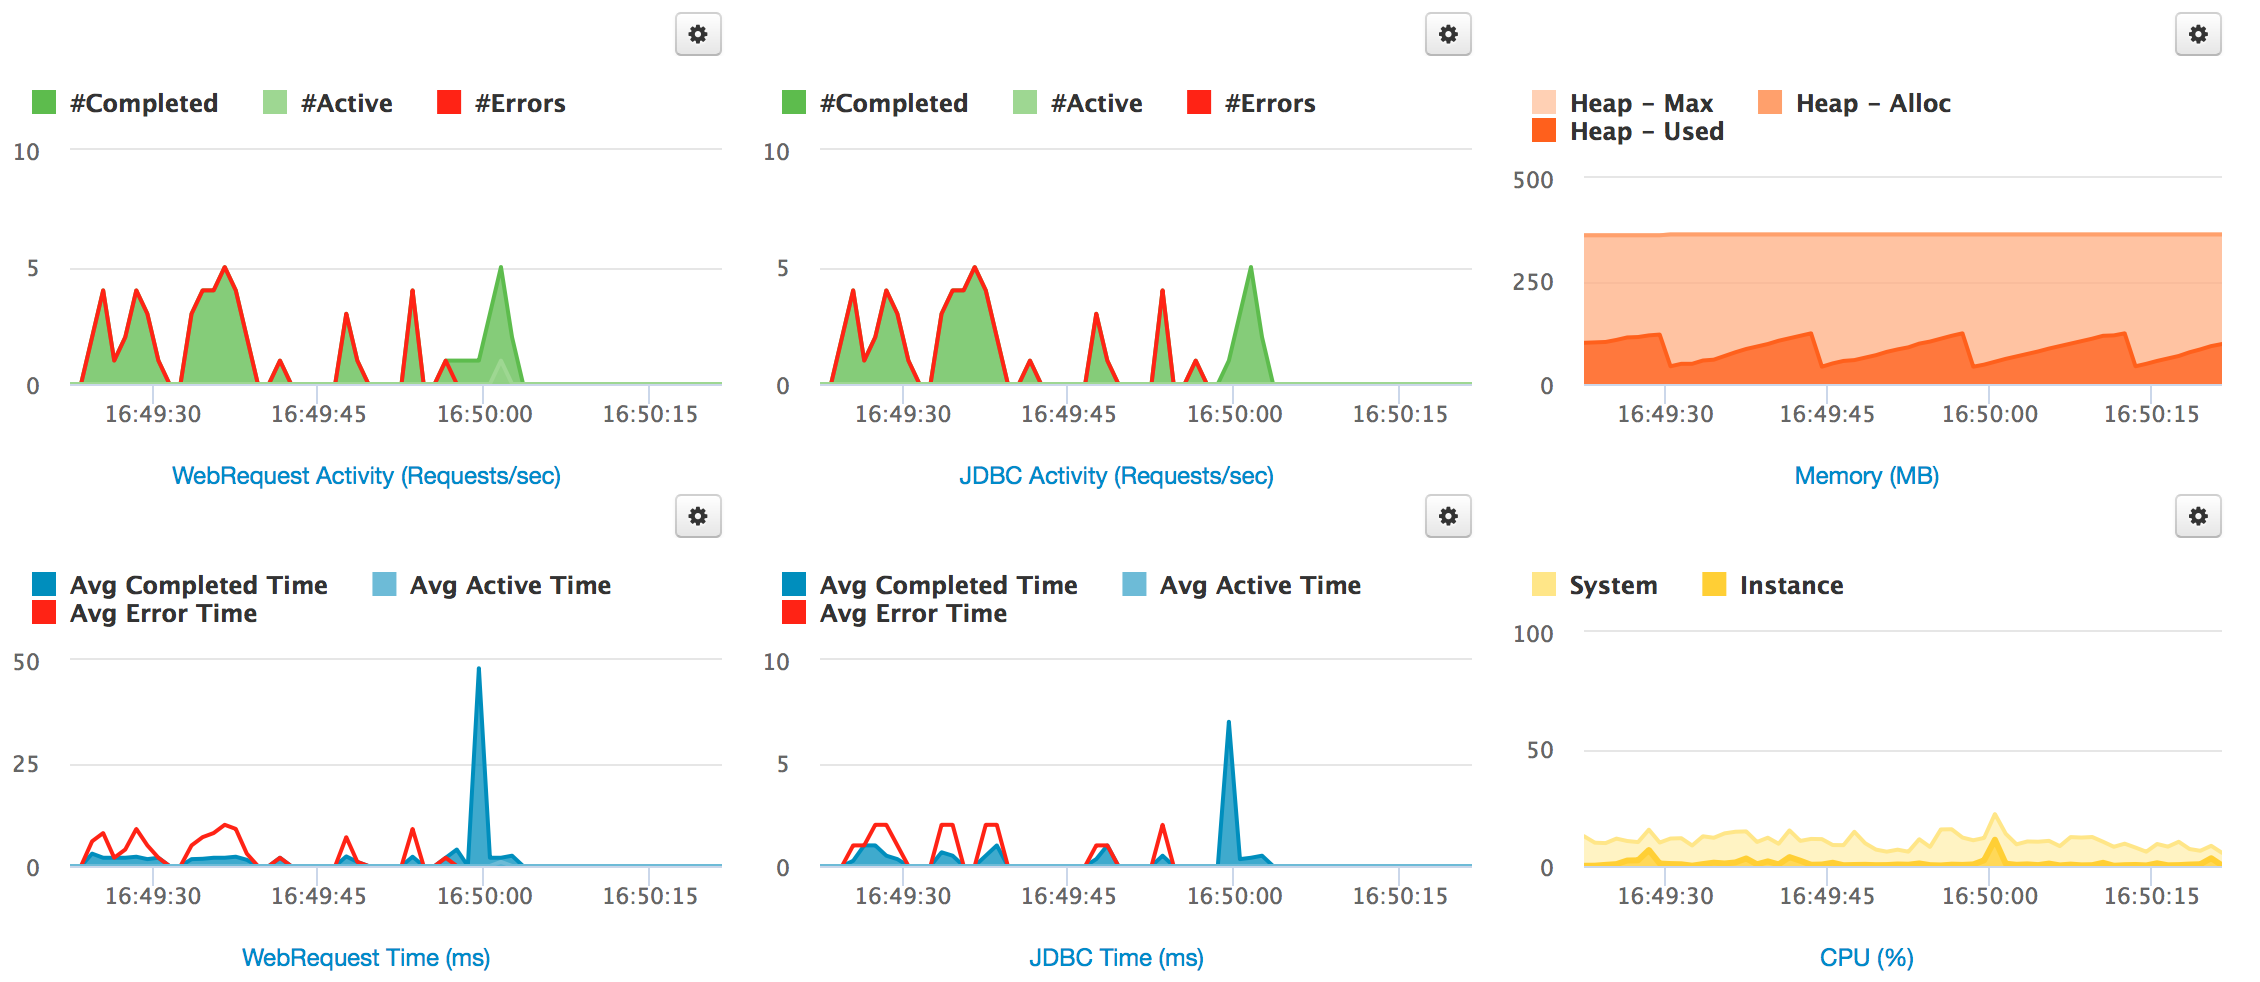
The Web Metrics section displays data related to your application server and its request load in an organised and easy-to-analyse structure.
WebRequest Activity
The number of requests completed and active requests at a given time. Track number of errors.
WebRequest Time
The average time of all completed and active requests at a given time. Track runtime of requests which ended in error.
JDBC Activity
The number of JDBC requests completed and active requests at a given time. Track number of errors.
JDBC Time
The average time of all completed and active JDBC requests at a given time. Track runtime of JDBC statements which ended in error.
Memory (MB)
The memory usage of your server, showing three types: Max memory, Allocated memory, and Used memory.
CPU(%)
The CPU load of two types: your server, and your application server instance.
Request Section
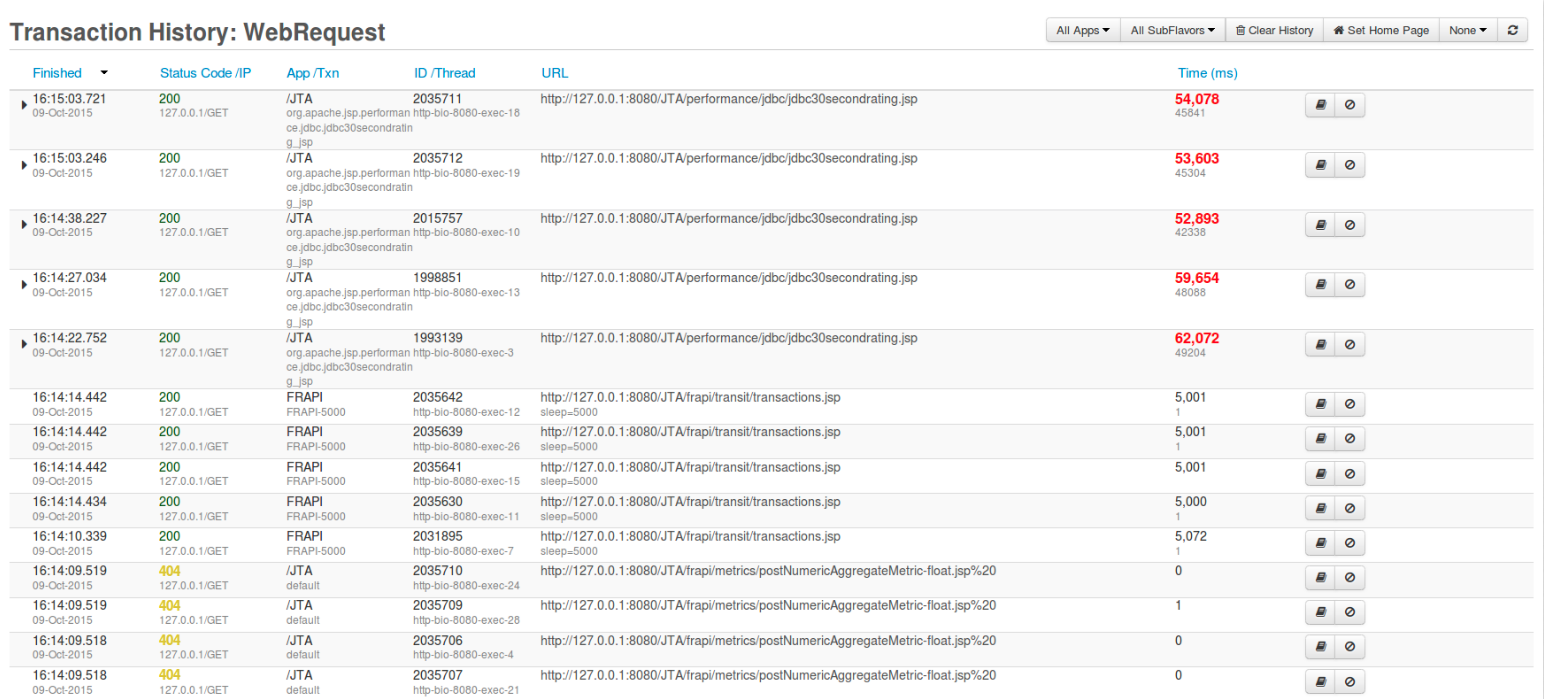
The Web Requests and History page shows a list of the most-recently completed requests. The number of historical requests stored is configurable; the default is set to 100. All the request information is stored in memory; as new requests enter the list, older requests are removed.
- You can go to the Detail page from any page which lists requests and pages linked from Request Metrics.
- Clicking the Request Details button by a request or clicking on the url field takes you to a page which contain detailed information about that request.
JDBC Section
JDBC History shows a list of completed JDBC transactions and shows slow JDBC query calls details. For each JDBC transaction shown, you can see the starting time, the IP address of the client which created it, the JDBC Statement which was executed and the amount of time it has been running and slow transactions.
Profiler section
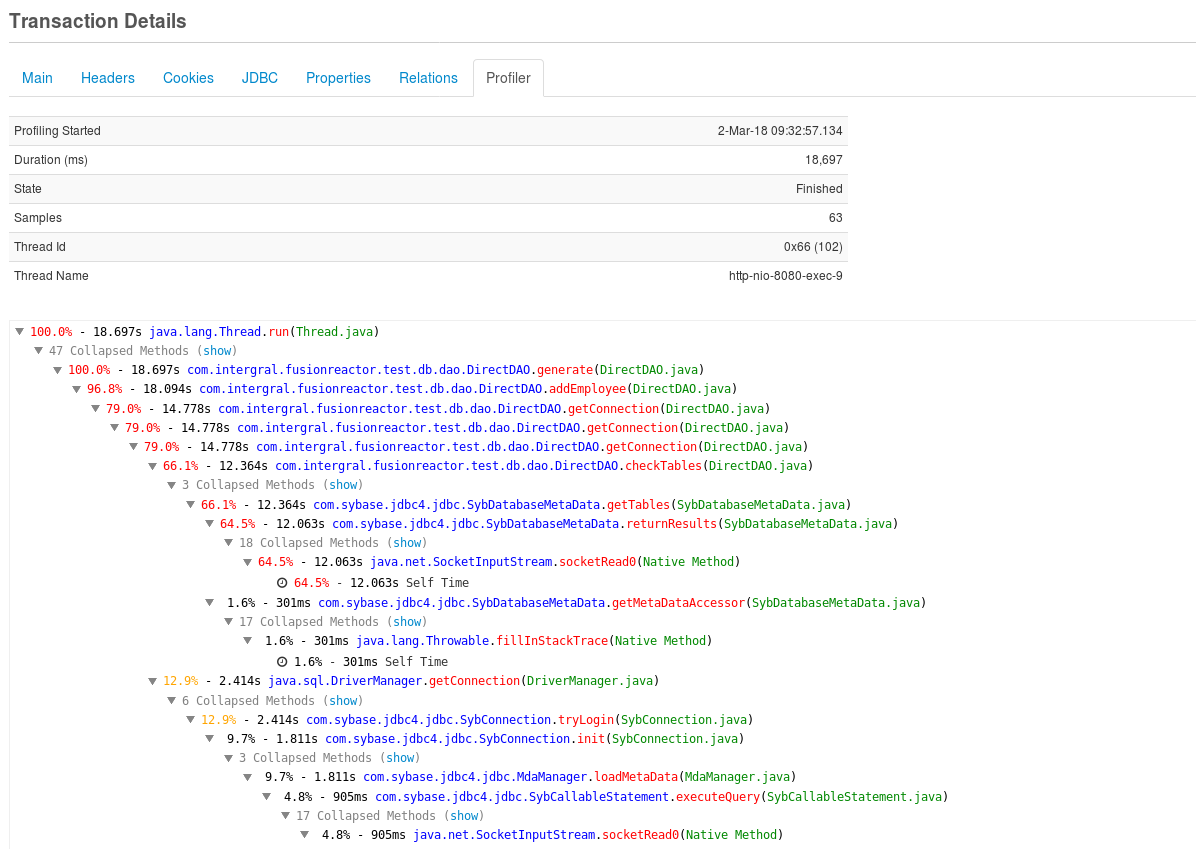
This section provides you more information about the Code Profiler Details of a transaction or thread. To discover what part of an application (method) consumes the most amount of CPU and Time, you can use the profiler to do that. Essentially, the Code Profiler can be used to isolate performance bottlenecks in your code.
When you access the Profiler tab in the transaction details, you should be able to see something as shown in the screenshot below.
These sections help identify the root cause of slowness, and monitoring the requests.
For more details on debugging, see intergral documentaion, and for the sample live demo, see this demo of fusion reactor.
