Charts - Displaying User Selection in another Widget
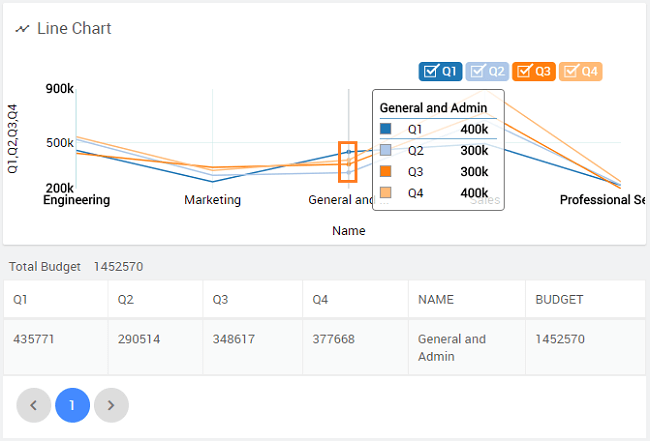
Hovering over the chart shows the values corresponding to the nearest data point. These data points can be captured and used to bind to a widget for further display or computational purposes. Here we will see how to do the same:
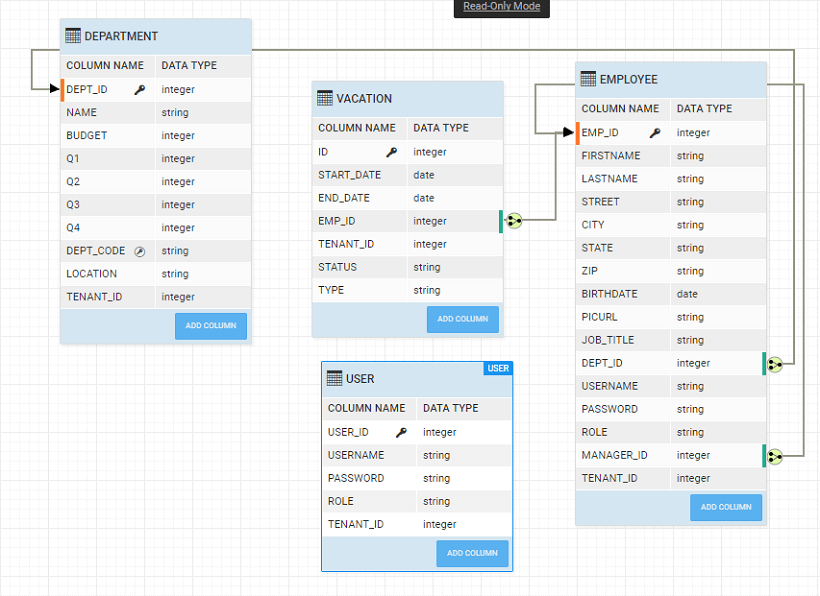
- We are using the Department DB available after importing the sample DB which ships with the product.
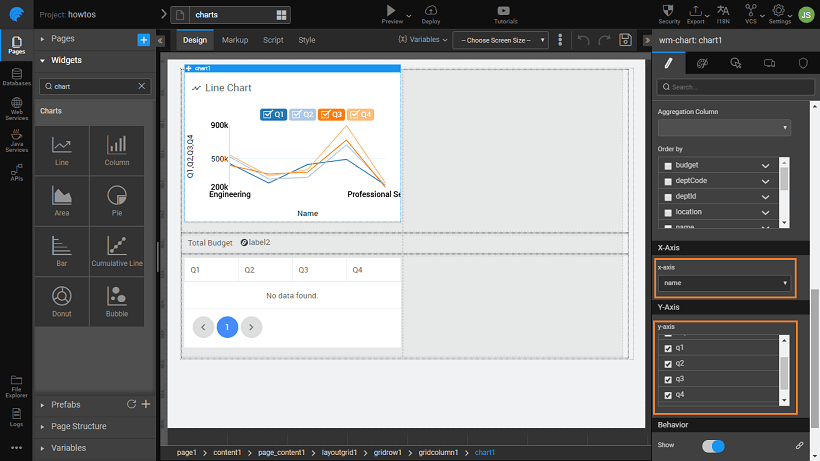
We have designed the canvas with a Grid Layout with three rows. We will have
- Chart widget,
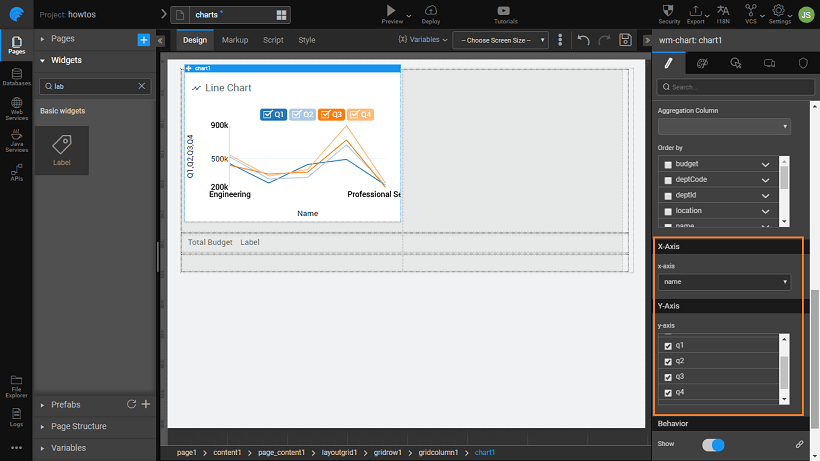
- two Label Widgets - to display the total budget of the selected department from the chart and
- a Data Table - to display the selected department details from the chart in each of the three rows.
Create a Database CRUD Variable (say, deptVar) using the Department table
Drag and drop a Line chart onto the first Grid row. Bind the chart widget to the Department dataset, and set x-axis to deptCode and y-axis to Q1, Q2, Q3, and Q4
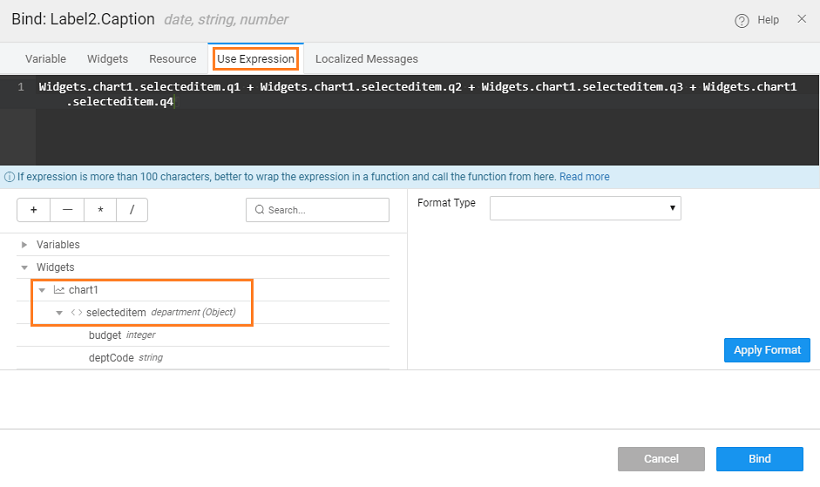
- Drag and drop two labels onto the second row of the Grid. Set the caption of one to say "Total Budget:". Bind the caption property of the second Label widget to display the total budget as the sum of Q1, Q2, Q3 and Q4 values from the selected item under chart widget using the Use Expression option in the bind dialog.
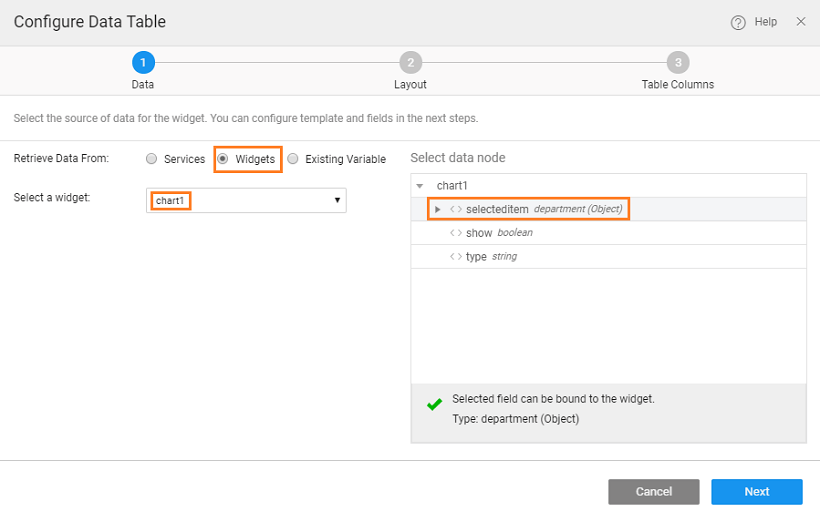
- Drag and drop a Data Table onto the third row of the Grid. Set the data source of the Data Table to the selected item of the chart widget. Choose the other settings as per your requirements. We have chosen a Read-only table and selected to display department id, name, budget, code, and location.
- Run the and click on one data point and see the total displayed in the label and the details displayed in the Data Table.
See Also
Chart Widget Cases
How to handling dynamic data
How to displaying custom data
